
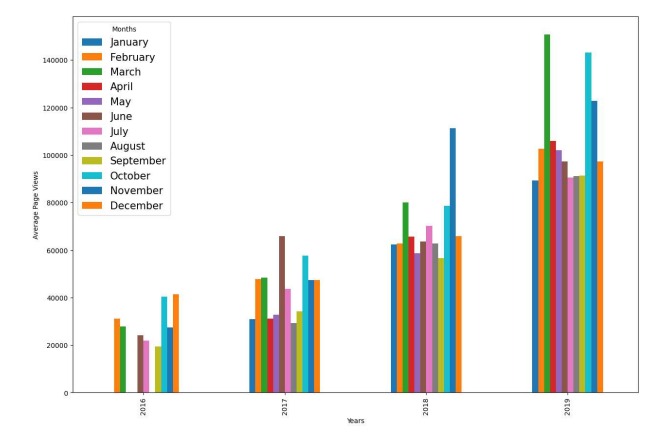
Forum views projects
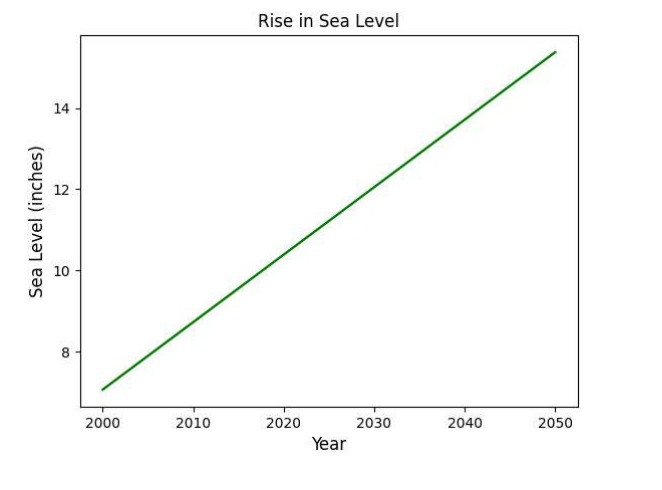
For this project I visualized time series data using a line chart, bar chart, and box plots. I used Pandas, Matplotlib, and Seaborn to visualize a dataset containing the number of page views each day on the freeCodeCamp.org forum from 2016-05-09 to 2019-12-03. The data visualizations will help you understand the patterns in visits and identify yearly and monthly growth.
Learn more